Projects
Current Projects
Deep Learning approaches to Galaxy Formation and Evolution with small datasets
June 2022 - May 2023
Supervisor: Dr. Yogesh Wadadekar, NCRA-TIFR
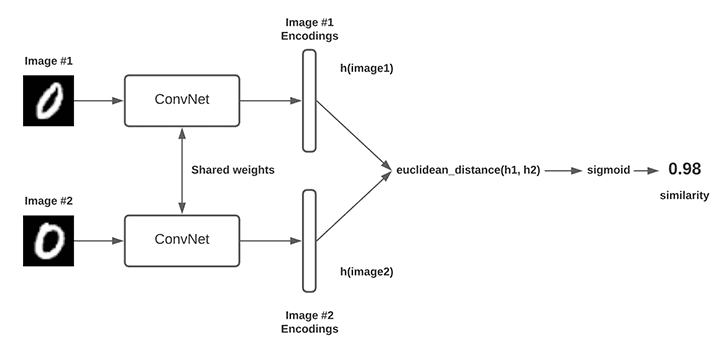
A Siamese Network, a classical example of an image classifier that is common in few shot learning research (image taken from this webpage). The Siamese network shown here follows a "pairwise" training method, where the loss is evaluated as the difference between the predicted similarity score and the real similarity score (1 if same class, 0 if different). In our study, we use prototypical networks and meta learning for building these few shot classifiers.
The formation and evolution of galaxies is strongly driven by secular as well as environmental processes. The effects of these processes have been probed by studying baryonic properties such as luminosity/stellar mass, star formation rate, stellar and gas kinematics, and various proxies for quantifying the environemnt of the galaxy. By studying the distribution of these properties in galaxy populations, one hopes to infer exact formation and evolution scenarios for different morphologies or morphological types of galaxies. While typical studies so far have focused on the correlations of atmost 2-3 parameters and their influence on the process of galaxy formation and evolution such as in Bait et. al. (2017) , using the latest SDSS-MaNGA galaxy survey, we perform a large scale study to identify the relative prominence of different parameters in deciding formation and evolution scenarios. There are galaxy populations that exhibit large deviances from the well understood evolution mechanisms, but are less in number. We are also developing a few shot learning based model that can look through large datasets and identify other instances of rare galaxy types to help us better understand the physics of formation and evolution of these properties.
Identifying and distinguishing the sources of ionization from the Epoch of Reionization
Sept 2021 - Present
Supervisor: Dr. Tirthankar Roy Choudhury, NCRA-TIFR
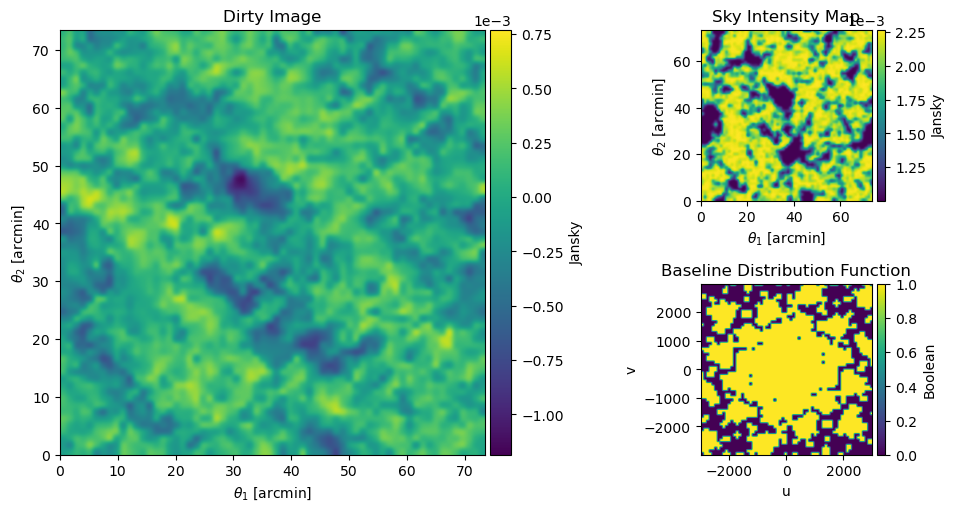
Picture shows the dirty image of the sky (left) as obtained by convolving the baseline distribution function for the SKA Low-1 configuration (bottom right) with the sky image obtained from SCRIPT (top right)
The intergalactic medium is in an extremely ionized state across cosmological scales in the present epoch. This was however not the case right after the matter-radiation decoupling epoch, which happened at around redshift 1000 (~380,000 years after the Big Bang). It is estimated that between redshifts of 15 and 7 (within the first billion years since the Big Bang), the first sources of light switched on in the universe. The ionizing radiation from these sources propogated through the IGM in a nearly spherically symmetric manner, ionizing it. One of the big projects to identify these sources will be the Square Kilometer Array, a radio telescope which is expected to start collecting data from 2027 onwards. Among the different ionizing sources (quasars, mini-quasars and stars), we wish to distinguish between quasars, which are postulated to be the biggest driver of reionization, and other ionizing sources. Ghara and Choudhury (2020) showed that it is not possible to distinguish between the quasar and no-quasar driving source using just a size based comparision. The current project is to develop data science techniques that will be able to distinguish between the two formation scenarios. For this, we are trying out two different techniques - a CNN based classifier that can distinguish between the visibility maps from these two reionization scenarios, and evidence based nested sampling technqiues that can possibly distinguish between the two reionization models.
Past Projects
Network Analysis to identify Climate Correlations - A Case Study using Indian Summer Monsoon
Jan 2022 - Apr 2022
Supervisor: Dr. Amit Apte, IISER Pune

The diagram on the left shows the distribution of the degree of a "node" (spatial bin), where the edge strength is defined using mutual information, derived from the time series using the Bandt-Pompe method. It is difficult to understand why a node displays high degree as it could be due to a variety of factors. The figure on the right shows how the KL divergence of the rainfall distribution relates across different years of rainfall - clearly, there is no correlation between different years with the same rainfall pattern, indicating either the analysis tools are insufficient to probe the rainfall distribution, or no conclusive relation exists between rainfall patterns.
Climate systems are extremely complex systems which are notoriously difficult to model using simple dynamic systems. They exhibit rich spatio-temporal behaviour such as correlations over large distances (teleconnections), sudden and rapid phase transitions between different states to name a few. Network science has been very successful in modelling complex interactions between different components of a complex system, and we attempt to perform a network analysis of the rainfall distribution over the Indian subcontinent. The goal was to identify if networks can indeed capture the rich dynamic behaviour of the spatiotemporal distribution of monsoon, and whether this can be used to identify socially and economically important events like the time of onset of Indian monsoon, the duration and the amount of rainfall during this period. We found that network properties are extremely difficult to gather physical evidence from, and they poorly capture the variation in Indian monsoon across different years. We also concluded that it is meaningless to use network analysis on non-discrete objects, and constructing discrete objects such as spatial bins is almost arbitrary and unphysical in network analysis.
Survey of Pulsars detected in the GMRT High Resolution Southern Sky Survey
Oct 2019 - Dec 2019
Supervisor: Dr. Bhaswati Bhattacharyya, NCRA-TIFR
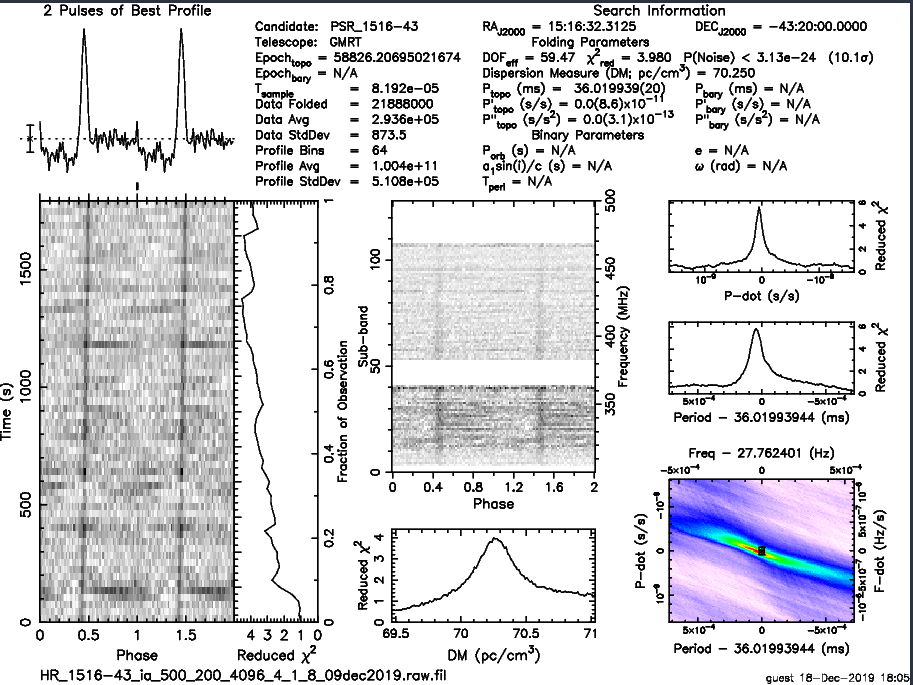
Folded pulsar candidate PSR_1516-43. This is a known pulsar that had been folded with its known time period, purely for visualization
This was done as a part of my NIUS program. The task was to identify pulsars from potential candidates. In order to increase the signal to noise ratio of detected pulsars, we had to "fold" the data, before which mitigation of radio frequency interference had to be performed. The tasks were performed using PRESTO, a program that, among other functions, could fold and be used for RFI mitigation. I wrote a bash script that could cycle through multiple potential candidates and sped up the labour intensive trial and error process required for identifying the ideal RFI mitigation and fold parameters. I continued related work during the pandemic, investigating the duty cycle distribution of pulsars. I was able to independently recreate the results of Henry and Paik (1969) that explained this observed distribution of duty cycles.